
Lisa Smithers1
1 Department of Optical Engineering Cranberry-Lemon University, Pittsburgh, PA, USA
Abstract
Ever since Todd began his internship in our LIDAR lab, our system accuracy has taken a nosedive. As LIDAR advances in accuracy are becoming increasingly important in applications such as Autonomous Vehicles, Precision Agriculture, Aerial inspection/surveying/mapping, robotics and much more, our sudden degradation halted research. At first, I thought I was distracted trying to figure out if Todd was flirting with me, or I broke some of our equipment, or I had a bug in our translation software, but after three new LIDARs we determined that Todd is just too FREAKIN HOT! His temperature gradients create too much hot steamy turbulence that it’s breaking all our optical systems! Especially when he flicks his hair! This paper introduces a novel method to characterize his unique Hawtness induced optical turbulence and a Wiener filter mitigation method. It helped for a while, then he brought a guitar into the lab.
Keywords: Optical Turbulence, Todd, LIDAR, Hair, Optics, Atmospheric Characterization, Todd, Noise Modeling
1. Introduction
In any optical system, turbulence is often a major source of error, range, and intensity. As Todd is the hottest thing at Cranberry-Lemon University [1], some say maybe even the greater Pittsburgh area [2]. He is a walking temperature gradient and the second he steps in our lab, the CN2 shoots through the roof! Like good Lord! Our LIDARs were designed for most engineers who I’ve never seen create turbulence let alone turn any heads. I mean not even on a good week when their skin is clear. Shoot, I thought I was hot even John, but not nearly on his level. Woof…
Because I really need some presentable results for my thesis, we really need to mitigate his turbulence. I would ask him to leave the lab, but it just seemed too rude, I mean, to my advisor who got me the funding for an intern, not Todd, I’m sure he’s got plenty of labs he could work in. Additionally, ever since he started working with us, I’ve never collected so much data in my life! As shown in [3], there is a method to mitigate such turbulence using a Wiener filter. It just came up while I was googling solutions.
2. Background
Optical turbulence occurs when pockets or surfaces of airs have differentials in temperature. These can be especially caused by hot surfaces such as sunbaked dirt in the desert or asphalt in the summer. Hot surfaces like Todd’s pose optical design challenges due to the intensity and unpredictability of turbulence never yet observed by optics engineers. Todd is a senior Electrical Engineering undergrad at CLU that began working in our LIDAR lab a few weeks ago and he is one hot surface. I mean, just look at figure 1…
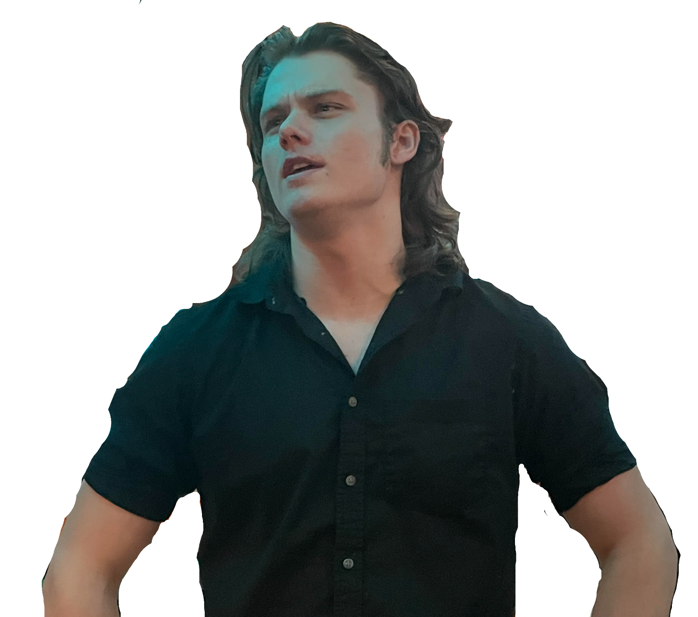
Figure 1: Todd
A previous CLU study showed that some turbulence may be corrected using a healing crystal based adaptive optics technique [4]. Unfortunately, he’s a Leo…There are three things that need to be modeled in order to account for his turbulence, his hair, his overall vibe, and when he starts humming.
2.1 Todd’s Hair
Okay, so even if we were ever able to estimate the turbulence around just his presence, every so often he flick’s his hair out of his eyes and the CN2 like doubles or triples! It’s just that perfect dark wavy shiny hair you just wana stick your fingers in. I don’t even know how he got here and isn’t some model in NYC! It’s like messy, but not too messy. I can’t tell if he uses styling gel or is just lucky every single day. I smelled his head as I was looking over his computer screen while he was integrating in a new sensor. I was making sure he had the right config file when I caught a whiff, and it sent shivers down my spine. Like, it wasn’t just my LIDAR readings, that CN2 was high, I know what high CN2 smells like, like you’re trapped in a snowed in cabin with only candles for light sort of high CN2 and you only have one blanket you have to share for the rest of the night.
2.2 Todd’s Vibe
He just has that attitude ya know? He’s got this energy about him that makes everyone pay attention when he walks into a room. He’s confident, but not in an arrogant way, and he’s always making people laugh. He’s got these piercing eyes that just draw you in, and a smile that lights up his whole face. But not always. Sometimes he looks real serious, like what’s going on in that head of his? I don’t know, but I want to. I shouldn’t. I’d get in trouble. And, of course, he’s got that swag. Every time I see him, my heart starts racing and my mind just goes completely blank just before my experiments start failing. Last Thursday, we were getting some stable LIDAR readings mapping out the interior of our building when he looked my way, smiled, and asked how my day’s been going and the LIDAR just started reading noise, NOTHING ELSE, like I’ve never seen that before.
2.3 OMG when Todd Sings
It’s like he’s got constant background music in his head. I don’t know what it is, but he’s like constantly doing this low hum of all my favorite songs like I’m listening to Fall Out Boy. Except it’s not like loud, he’s just kinda muttering the lyrics or humming the melody and chorus while he’s doing data management on our readings that day. Anyway, I kept track one day while secretly recording him on our LIDAR we were using to create point clouds in the room and compared the results at one-minute increments and the accuracy can be seen in figure 2. That’s not weird right, to be secretly recording him on my LIDAR? I mean I had to do it, for the experiment.
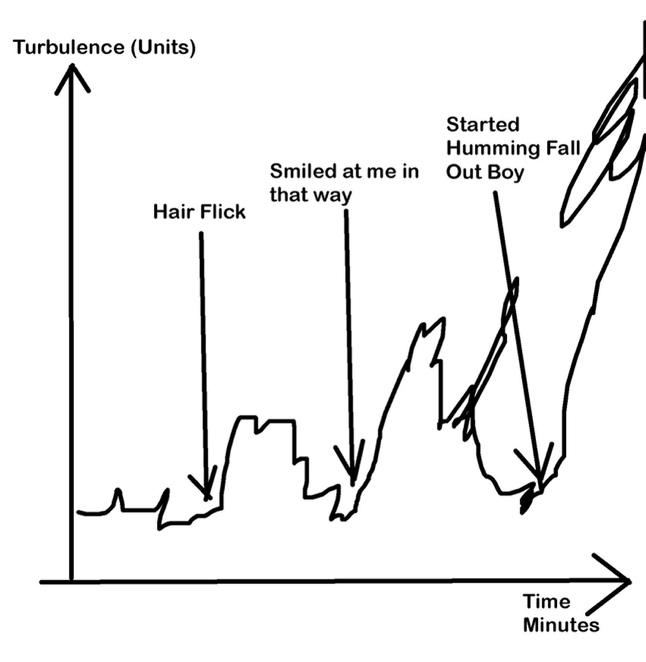
Figure 2: Todd Scintillation Plot Annotated
3. Characterization
Adapting the modeling process in [3], Kolmogorov’s turbulence model was used to estimate the tilt variance, Optical Transfer Function, and then the LIDAR return observation model for Near Todd LIDAR Measurements (NTLM). The Todd Induced Gaussian Noise (TIGN) was then be modeled by posting our secret videos of him on TikTok and measuring the likes.
3.1 Kolmogorov Turbulence Model Adaption
First, the Kolmogorov model was adapted through the Fried Parameter to develop a statistic for the atmospheric coherence diameter as shown in 1 where CN2 is integrated from the initial Todd Induced Atmosphere (TIA) and the end point of TIA. This will be necessary to deconvolve errors from sensing near Todd.

Next the tilt variance will be estimated using 2 where the same CN2 is multiplied and integrated from some slightly other things
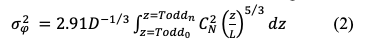
This Todd Induced Tilt Variance (TITV) will be used to track, estimate, and filter out errors resulting from NTLM.
3.2 Optical Transfer Function
In order to trace the tilt error variance to LIDAR measurements, an Optical Transfer Function (OTF) and resulting Modular Transfer Function (MTF) will be derived for overall camera performance given a certain TIGN. This can be done by applying the equation in 3 where is represented by spatial frequencies in some sort of radians more or less multiplied by at some point in the process.

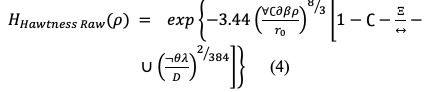
Next, the atmospheric transfer function in 4 and the TIA transfer function in 5 will give a structure to model the entire ‘Hawtness’ process. Where everything is some standard physics parameters, C is a constant and ∄ is my birthday.
Skipping a few steps, we took a generous amount of Fourier Transforms of some things while heavily abusing equal parts Wolfram Alpha and MATLAB resulting in Figure 3 to describe the Point Spread Function of light travelling near Todd after adding in the TIGN across an arbitrary amount of Monte-Carlo’d data across a hefty frequency spectrum. We forgot to properly label our axes, but at that point it was way too late.
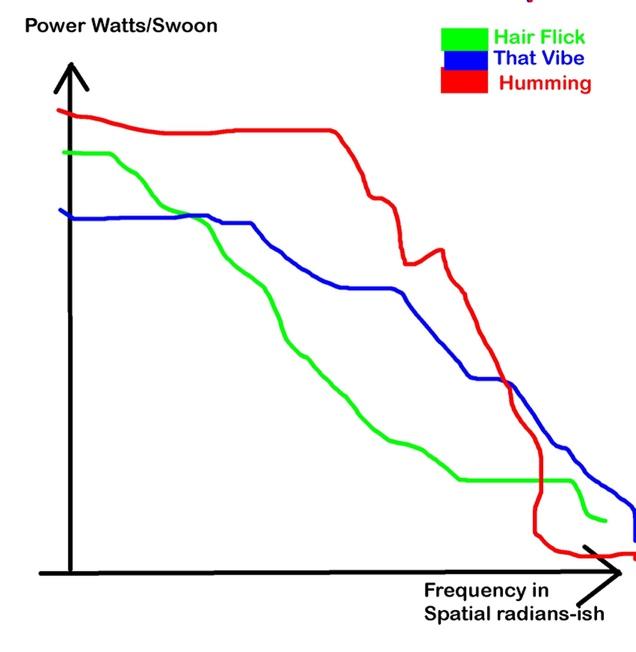
Figure 3: Todd Induced Gaussian Noise Point Spread Function
3.3 Observation Model
Taking all of our transfer functions, and some others we pulled out of some old textbooks we felt like we should include, we initially defined an observation model in 6 involving our previous designed transfer functions and a scary fudge factor function we’d fill in with a large number of standard Greek and Hebrew letters at a later date SL(x).

At first, we decided to add some additional noise to our TIGN noisy transfer observation model. This is shown in 7.

It didn’t look quite right so we tried moving that noise around as shown in 8

Something else felt fishy so we multiplied it all by pi/180 as shown in 9. I think it was in degrees and should be in radians but I wasn’t sure.
10 shows us placing the additional noise somewhere else for better fung shui.
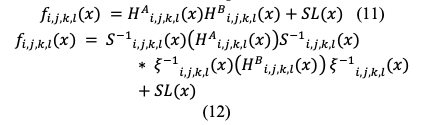
After careful analysis and a particularly rough weekly meeting with my committee where they made fun of my naming convention, we decided to put everything back where it was originally as shown in 11 before taking some messy inversions as shown in 12 which I don’t understand but my advisor said involved safe assumptions.
We were told specifically to not move anything else around even if it looked nicer. I wish it looked nicer, like Todd.
3.4 CN2 (z) TikTok Mapping
Unfortunately, TIGN is not a Stationary process and honestly, that sort of unpredictability is what makes him so hot in the first place. Every day just feels like an adventure. Unfortunately, this does not bode well for our turbulence modelling. Damn his free spirit. Initially, we attempted to keep detailed notes on how Hot he was throughout the day, but we couldn’t figure out how to quantify the hotness in words as there weren’t enough in the dictionary.
Alternatively, and easier to quantify, we took a few minutes of video of Todd in various activities and uploaded them to TikTok. From there, we could capture a second-by-second track of likes throughout each video and correlate each to an expected amount of CN2 in the spatial and time domain for eventual LIDAR correction and filtering.
4. Wiener Filtering
Through the characterized TIA, the estimated Point Spread Function may be used to apply a Wiener filter and correct to Todd induced error. The measured TIGN was then used to estimate the optimum parameters. Finally, the Todd Correction Time Stamp was tracked using live Todd data measuring the estimated CN2 which was determined by his TikTok quantified turbulence.
4.1 Filter Design
A block diagram in figure 4 shows how a windowed amount of NTLM’s can be integrated optimally into the Wiener filter. First, the NTLM’s are associated with timestamped Todd adjusted CN2 estimates. Next, each of the turbulence estimates are ensembled before shortly being fused with the most recent NTLM. Finally, they are fed into the Wiener filter informed by our well-established Point Spread Function transformed into the 2d Dimensionality of our LIDAR measurements. Out of our brilliant filter implementation, we’ll be able to keep that wonderful hunk in our lab without having to spend another year slaving away over this Thesis!
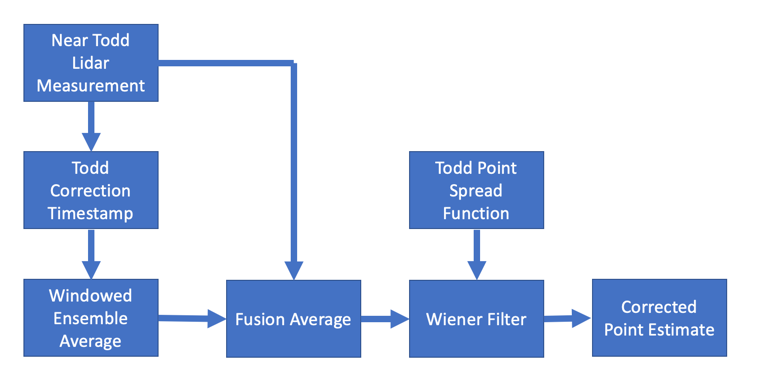
Figure 4: Wiener Filter Model
4.2 Coefficient Estimation
Unfortunately, our initial TIA characterization determined that all the Greek letters in our PSF equations weren’t Stationary. Sometimes Todd is just in one of those moods where ya wana cheer him up but know that ya can’t, and others where you just have to stop and catch your breath when he scratches his head after I give him a tough problem. God if I were single, I’d take him in a heartbeat. Uhh, anyway, based on the parameters in table 1, many of our Greek letters can be estimated using historic Todd data categorized by motion vector intensity and perceived hotness. Though it is highly dimensional data, his posterior is well defined [5], uhh model posterior.
| Unit | Value |
| Facial Hair Stubble | 0.09 |
| Sincerity | 28.2 |
| Smolder | 0.94 |
| Hair Shine | 72.4 |
| Shoulder Width to Shoe Style Ratio | 6.21 |
| It Factor | 491 |
4.3 Live Todd Data Integration
Though most of the estimation parameters shown in table 1 can be quickly notated in my personal diary in the first minute of the day, some of Todd’s Hotness changes moment by moment based on his behavior described in section 2. We tried to get Todd to wear some instrumentation to measure some of this behavior but he said he “wasn’t much of a jewelry guy”. I was confused as he always wears a necklace with some shells on it underneath his shirt, but apparently, he only wears it because his Dad gave it to him before he died in his arms while they were mountaineering in Peru. F$#@ he’s Hot. To record the intensity of the TIA, heart monitors were worn by all the women of the lab and a couple of the guys. The statistical deviation of the heart monitors would be then filtered into the Todd Correction Timestep process in Figure 4. Based on the rhythm of the heart deviations, we could apply the pensive or the carnal Todd Hotness CN2 correction model.
5. Results
Three days of LIDAR data were gathered in order to test whether or not we could filter his Wiener. I mean, implement the Wiener filter. Damnit. Anyway, as shown in Figure 5, through the magic of post processing, our LIDAR accuracy for land surveillance applications has finally dipped back below the threshold for publishable results, so sayeth my advisor.
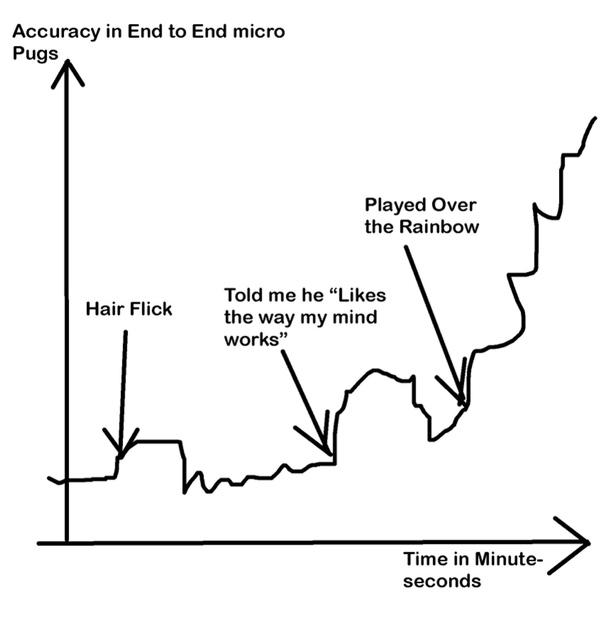
Figure 5: LIDAR accuracy results 100m
Unfortunately, towards the end of the testing period Todd put on a soft sweater, got out a ukulele and began playing Over the Rainbow [6]. We have determined that there is no amount of Wiener filtering that could correct for that amount of Todd Induced Turbulence and called that data an outlier. If my husband asks during my thesis defense, it was an unexpected temperature inversion event because someone opened the window. We did have to open the window so that’s not a lie. You know how my Husband is [7].
6. Conclusion
Using our Wiener Filter mitigation technique adapted from [3], we were successfully able to average and correct for the effects of turbulence on our LIDAR data and continue our research with trusted data and *sigh* faithful point cloud reconstruction fidelity. It’s not like a little LIDAR infidelity wouldn’t be the end of the world, I’m sure the data would just be as good. I’m sure it would make some applications exciting, having to retake some points in that dirty, dirty, uncertainty. Everything’s a little uncertain, it’s not like we must account for every little bit of turbulence. If this algorithm slips up just once, and WE DOCUMENTED WHERE THAT MIGHT HAPPEN, I still think it’s rock solid. I love you John, no matter what. Further results in Appendix A.
References
- Smithers, Lisa 2022 A Quantitative Analysis of the Hottest Boys at Cranberry Lemon University :: Journal of Comparative Sexiness
- Smithers, Lisa 2022 Theoretical Sexy-Dynamics Comparitive Analysis of The Available Bachelors of Pennsylvania :: Journal of Comparative Sexiness
- Russel C. Hardie et Al 2017 Block Matching and Wiener Filtering Approach to Optical Turbulence Mitigation and its Application to Simulated and Real Imagery with Quantitative Error Analysis
- Starquiver, Aquaria 2022 Ray Tracing and Optical Design of Healing Crystals Based Adaptive Optics :: Journal of Astrological Big Data Ecology
- 2022 Bayesian Man Seeking more defined Posterior won’t give up Squat Rack :: Journal of Astrological Big Data Ecology
- Smithers, Lisa 2023 Global record of Maximum Hawtness: Optimal Musical Woo-ness Design :: Journal of Comparative Musical Courtship
- Smithers, Lisa 2019 A Qualitative Characterization of my Husband John’s Overreaction to Applebee’s Waiter Flirtation-ness and How to stop another Potential Assault Charge in order to make this Relationship Work because I Love Him :: Journal of Taming the One
Appendix A: Follow on Results
I did it, I freaking did it! I had to take some more measurements to recreate a graph and I was able to do it. Todd wanted to play some new song for me he just learned. I told him no; I have a Migraine, wasn’t in the mood, and he went back to doing some homework. This isn’t that important for this paper. I just needed to brag and tell somebody that I was able to keep my data pure like my priest, or advisor I mean told me I should after our counselling. It was close though, I’m not gonna lie.
If you enjoyed this well peer reviewed article Correcting for the Extreme Hawtness induced Turbulence from Todd please like, share, and subscribe with your email, our twitter handle (@JABDE6), our facebook group here, or the Journal of Immaterial Science Subreddit for weekly content, and keep a look out for our upcoming print book!
If you REEEEALY love the content, for the equivalent price of a Chipotle Burrito, chips and Queso, you could buy our new book Et Al with over 20 hand picked Jabde articles for your reading pleasure, it’s the perfect Christmas/Birthday gift for confusing your unsuspecting family members! Order on amazon here: https://packt.link/at4bw Please rate and review so that you can brag to your friends about having opinions or showcase your excellent taste in reading material!
